Market Data · Market Insights
Monthly data through July 2026 · Site-wide access date 2026-08-30
Population is the base layer of housing demand, the number of residential registrations is the ground-level indicator of actual market transactions, and median household income by district shows which areas are seeing the fastest growth in purchasing power. The data below defaults to the most recent 15 years (2011–2025); some indicators (population / price and rental indices / completions) can be dragged back as far as 1961 for the long-term historical view. All figures are matched against official published data from the Census and Statistics Department, the Land Registry, and the Rating and Valuation Department, so you can quickly get a grip on the overall Hong Kong property market.
Want to explore the data yourself? The two tools below let you pick the indicators you want to see, overlay up to three at once for comparison, and drag the sliders to customise the time range and aggregation granularity. Use the 15-year annual overview for the long-term view, and the 36-month detail (switchable between month/quarter/year) for the latest trend. The trend charts from each section below have all been merged into this interactive explorer — each section further down keeps only its data table and analysis text for looking up exact figures, so the static charts aren't repeated.
Annual Overview (defaults to the last 15 years; population/indices/completions can go back to 1961)
Population / registration count / contract value: Census and Statistics Department + Land Registry|Completions / price index / rental index: Rating and Valuation Department (RVD, base 1999=100). Machine-readable official data for registration count/contract value only covers 2021 onward (2011-2020 are manually verified constants); there is no earlier official data, so these two series will show a gap before 2011 (this is not an omission on this site). Accessed: 2026-08-30.
36-Month Detail (August 2023 – July 2026)
The monthly detail view only covers the most recent 3 years (there is no monthly history for 2011-2022 — see the annual panel above for the long-term view). For "Year" aggregation, the first and last periods (2023/2026) only have half a year of data and will be labelled "(half year)". Price/rental indices are updated through July 2026; May-July 2026 are official provisional (P) figures and may be revised.
Population rose steadily from 2015 to 2019 (mainly traditional growth via One-way Permit arrivals); from 2019 to 2022 it fell sharply due to a combination of social unrest, the National Security Law, the BNO emigration wave, and the pandemic; the launch of the Top Talent Pass Scheme in late 2022, combined with the full border reopening in early 2023, drove a rebound of nearly 190,000 within a year, and talent inflow has since offset the natural population decline, keeping the total hovering around 7.5 million.
| Year (mid-year) | Population (10k) |
|---|---|
| 2011 | 707.2 |
| 2012 | 715.0 |
| 2013 | 717.9 |
| 2014 | 723.0 |
| 2015 | 729.1 |
| 2016 | 733.7 |
| 2017 | 739.3 |
| 2018 | 745.3 |
| 2019 | 750.8 |
| 2020 | 748.1 |
| 2021 | 741.3 |
| 2022 | 734.6 |
| 2023 | 753.6 |
| 2024 | 752.4 |
| 2025 | 749.9 |
Source: Census and Statistics Department, Table 110-01001 (resident population basis, mid-year figures). Accessed: 2026-08-30.
The primary market's share has trended up over the long term: it was only 13% in 2011, rising to 33% by 2025 — during the years of tightening measures, developers used rebates and high-LTV mortgage arrangements to draw buyers away from the second-hand market; even so, 2025's 42,292 second-hand registrations were still double the primary figure, so second-hand remains the volume leader. Registration counts are highly sensitive to policy: the 2013 Double Stamp Duty caused second-hand registrations to halve within the same year (68,365→39,630); after all cooling measures were fully removed in February 2024, a single-month surge followed, with the full-year total rebounding to 53,099; 2022-2023 fell to a 15-year low (43,002 to 45,050) under the weight of rising interest rates.
| Year | New (Primary) | Second-hand | Total |
|---|---|---|---|
| 2011 | 10,880 | 73,582 | 84,462 |
| 2012 | 12,968 | 68,365 | 81,333 |
| 2013 | 11,046 | 39,630 | 50,676 |
| 2014 | 16,857 | 46,950 | 63,807 |
| 2015 | 16,826 | 39,156 | 55,982 |
| 2016 | 16,793 | 37,908 | 54,701 |
| 2017 | 18,645 | 42,946 | 61,591 |
| 2018 | 15,633 | 41,614 | 57,247 |
| 2019 | 21,108 | 38,689 | 59,797 |
| 2020 | 15,317 | 44,563 | 59,880 |
| 2021 | 17,650 | 56,647 | 74,297 |
| 2022 | 10,315 | 34,735 | 45,050 |
| 2023 | 10,752 | 32,250 | 43,002 |
| 2024 | 16,912 | 36,187 | 53,099 |
| 2025 | 20,540 | 42,292 | 62,832 |
Source: Land Registry, "Statistics on Residential Property Sale and Purchase Agreements: Primary and Secondary Market". Accessed: 2026-08-30. Registration figures generally reflect agreements submitted for registration within about 30 days of signing, so they are a lagging indicator; they exclude subsidised housing such as Home Ownership Scheme/Tenants Purchase Scheme flats (except resale after premium payment).
Registration count and value don't always move in lockstep: 2021's 74,297 registrations, while not the 15-year high (2011 had more, at 84,462), still produced the highest total contract value of the 15 years at HK$733.9 billion — reflecting that year's elevated market prices and larger per-transaction sums; conversely, 2011/2012 had more registrations but relatively flat prices, so total value was actually lower (HK$442.5bn/HK$452.3bn). The 2013 Double Stamp Duty caused both registrations and value to halve together (value fell to a 15-year low of HK$298.9bn); total value has been gradually recovering since the cooling measures were fully removed in 2024/2025, reaching HK$519.8bn in 2025 — still below the HK$550-730bn range seen in the five years from 2017-2021.
| Year | New (Primary) (HK$M) | Second-hand (HK$M) | Total (HK$M) |
|---|---|---|---|
| 2011 | 130,885 | 311,638 | 442,527 |
| 2012 | 130,968 | 321,308 | 452,275 |
| 2013 | 95,872 | 203,070 | 298,942 |
| 2014 | 176,157 | 257,260 | 433,418 |
| 2015 | 161,028 | 255,493 | 416,520 |
| 2016 | 186,589 | 241,452 | 428,041 |
| 2017 | 240,512 | 315,838 | 556,348 |
| 2018 | 219,505 | 339,788 | 559,293 |
| 2019 | 227,603 | 321,190 | 548,795 |
| 2020 | 169,774 | 378,459 | 548,233 |
| 2021 | 230,888 | 503,017 | 733,904 |
| 2022 | 109,722 | 297,999 | 407,723 |
| 2023 | 127,628 | 261,623 | 389,247 |
| 2024 | 193,075 | 261,280 | 454,356 |
| 2025 | 220,826 | 299,005 | 519,830 |
Source: Land Registry, "Value of Residential Building Sale and Purchase Agreements (HK$ million): Primary and Secondary Market". Accessed: 2026-08-30. Individual line items may not add up exactly to the totals due to rounding (as noted in the official source's footnote).
Weighed down by rising rates, monthly registrations hovered at a low of 2,100 to 3,300 in the second half of 2023; after all cooling measures were fully removed on 28 February 2024, April alone surged to 8,551 (largely driven by developers pushing new launches, contributing 3,636 primary-market registrations); after the surge, the market went through a digestion phase from mid-2024 to early 2025, settling back to the 3,000-4,000 range; it began steadily climbing again from March 2025, continuing to strengthen through the first half of 2026, with June 2026 recording a 36-month high of 7,650 (1,993 primary + 5,657 second-hand). Note that monthly figures reflect agreements submitted for registration within about 30 days of signing, so they are a lagging indicator, and can be affected by seasonality (quieter around year-end/year-start) and one-off surges driven by a single large new-project launch.
| Month | New (Primary) | Second-hand | Total |
|---|---|---|---|
| 2023-07 | 810 | 2,255 | 3,065 |
| 2023-08 | 742 | 2,505 | 3,247 |
| 2023-09 | 964 | 1,898 | 2,862 |
| 2023-10 | 356 | 1,767 | 2,123 |
| 2023-11 | 547 | 2,007 | 2,554 |
| 2023-12 | 959 | 1,970 | 2,929 |
| 2024-01 | 1,003 | 2,474 | 3,477 |
| 2024-02 | 367 | 2,008 | 2,375 |
| 2024-03 | 1,499 | 2,472 | 3,971 |
| 2024-04 | 3,636 | 4,915 | 8,551 |
| 2024-05 | 1,934 | 3,612 | 5,546 |
| 2024-06 | 980 | 2,876 | 3,856 |
| 2024-07 | 826 | 2,897 | 3,723 |
| 2024-08 | 1,154 | 2,500 | 3,654 |
| 2024-09 | 521 | 2,327 | 2,848 |
| 2024-10 | 1,611 | 3,086 | 4,697 |
| 2024-11 | 2,494 | 3,804 | 6,298 |
| 2024-12 | 887 | 3,216 | 4,103 |
| 2025-01 | 768 | 2,858 | 3,626 |
| 2025-02 | 900 | 2,300 | 3,200 |
| 2025-03 | 2,229 | 3,138 | 5,367 |
| 2025-04 | 1,614 | 4,080 | 5,694 |
| 2025-05 | 1,676 | 3,429 | 5,105 |
| 2025-06 | 2,147 | 3,808 | 5,955 |
| 2025-07 | 1,865 | 3,901 | 5,766 |
| 2025-08 | 1,781 | 3,510 | 5,291 |
| 2025-09 | 1,974 | 3,669 | 5,643 |
| 2025-10 | 2,025 | 3,689 | 5,714 |
| 2025-11 | 1,822 | 3,766 | 5,588 |
| 2025-12 | 1,739 | 4,144 | 5,883 |
| 2026-01 | 1,542 | 4,127 | 5,669 |
| 2026-02 | 2,567 | 4,102 | 6,669 |
| 2026-03 | 1,443 | 4,873 | 6,316 |
| 2026-04 | 2,594 | 4,774 | 7,368 |
| 2026-05 | 2,410 | 4,728 | 7,138 |
| 2026-06 | 1,993 | 5,657 | 7,650 |
Source: Land Registry, "Statistics on Residential Property Sale and Purchase Agreements: Primary and Secondary Market" monthly figures (landreg.gov.hk/tc/monthly/agreement.htm). Accessed: 2026-08-30. July 2026 is the latest complete month published on the official website; no estimate has been made.
The value trend follows a similar shape to the registration-count trend, but with bigger swings: April 2024's post-cooling-measures surge produced a single-month value of HK$77.46bn (developer-driven primary launches contributed HK$42.35bn, over half the total); it then pulled back, holding in the HK$20-38bn range from mid-2024 to early 2025; it began climbing again gradually from March 2025, and kept building through the first quarter of 2026 onward, with June 2026 recording HK$75.61bn — although the registration count (7,650) was similar to April 2026's (7,368), the value was actually the second-highest of the 36 months, suggesting recent transactions have shifted toward higher per-square-foot prices or a bigger share of high-value units.
| Month | New (Primary) (HK$M) | Second-hand (HK$M) | Total (HK$M) |
|---|---|---|---|
| 2023-07 | 7,438 | 19,153 | 26,591 |
| 2023-08 | 8,440 | 20,205 | 28,645 |
| 2023-09 | 7,663 | 15,124 | 22,786 |
| 2023-10 | 4,805 | 19,693 | 24,497 |
| 2023-11 | 6,318 | 13,352 | 19,669 |
| 2023-12 | 9,684 | 14,640 | 24,324 |
| 2024-01 | 8,336 | 19,456 | 27,792 |
| 2024-02 | 5,677 | 13,419 | 19,096 |
| 2024-03 | 13,764 | 16,298 | 30,062 |
| 2024-04 | 42,350 | 35,106 | 77,456 |
| 2024-05 | 26,255 | 27,120 | 53,376 |
| 2024-06 | 12,026 | 22,465 | 34,491 |
| 2024-07 | 9,687 | 25,988 | 35,675 |
| 2024-08 | 11,253 | 17,218 | 28,471 |
| 2024-09 | 5,698 | 15,140 | 20,838 |
| 2024-10 | 16,072 | 21,203 | 37,275 |
| 2024-11 | 30,838 | 26,423 | 57,261 |
| 2024-12 | 11,119 | 21,444 | 32,563 |
| 2025-01 | 7,692 | 19,052 | 26,743 |
| 2025-02 | 8,368 | 14,646 | 23,014 |
| 2025-03 | 16,272 | 22,543 | 38,814 |
| 2025-04 | 13,475 | 28,722 | 42,197 |
| 2025-05 | 14,759 | 23,485 | 38,244 |
| 2025-06 | 34,544 | 26,517 | 61,061 |
| 2025-07 | 19,835 | 26,519 | 46,354 |
| 2025-08 | 17,575 | 24,633 | 42,208 |
| 2025-09 | 21,621 | 25,606 | 47,228 |
| 2025-10 | 23,856 | 27,217 | 51,073 |
| 2025-11 | 22,731 | 28,936 | 51,667 |
| 2025-12 | 20,098 | 31,129 | 51,227 |
| 2026-01 | 18,654 | 30,567 | 49,221 |
| 2026-02 | 26,124 | 31,474 | 57,598 |
| 2026-03 | 18,261 | 36,922 | 55,184 |
| 2026-04 | 28,976 | 34,697 | 63,673 |
| 2026-05 | 28,177 | 37,417 | 65,593 |
| 2026-06 | 28,760 | 46,848 | 75,607 |
Source: Land Registry, "Value of Residential Building Sale and Purchase Agreements (HK$ million): Primary and Secondary Market" monthly figures. Accessed: 2026-08-30. July 2026 is the latest complete month published on the official website; no estimate has been made.
Overlaying population (the base layer of housing demand) against registration count (actual market transactions) on the same chart shows the two don't always move together: population kept rising in 2013 while registrations halved (the Double Stamp Duty policy directly suppressed transactions — it had nothing to do with population); population fell sharply by nearly 16,000 in 2021-2022 (the emigration wave), yet registrations actually hit a 15-year high of 74,000 in 2021, and only bottomed out together with population in 2022-2023; since 2023, the Top Talent Pass Scheme has driven a population rebound, and registrations have risen in tandem. Conclusion: population is the base layer of medium-to-long-term demand, but short-term transaction volume is driven more by stamp duty policy and mortgage rates — you need to look at both indicators together, not judge the market from just one.
Compared against population, the value trend shows the impact of the "property price cycle" even more clearly than the registration count does: population was flat or even declining at a high level from 2019 to 2021, yet total contract value hit a 15-year high of HK$733.9bn in 2021 — showing that property prices (not population) were the main driver pushing up total value at the time; population and total value both fell sharply together in 2022-2023 (the double blow of the emigration wave and rising rates); since 2023, the Top Talent Pass Scheme has driven a population recovery, and total value has followed suit but more mildly (HK$519.8bn in 2025, still below the HK$550bn+ levels seen from 2017-2021). Conclusion: total value trends are driven more by the property price cycle than by population — a population rebound doesn't mean prices/total value will bounce back proportionally right away.
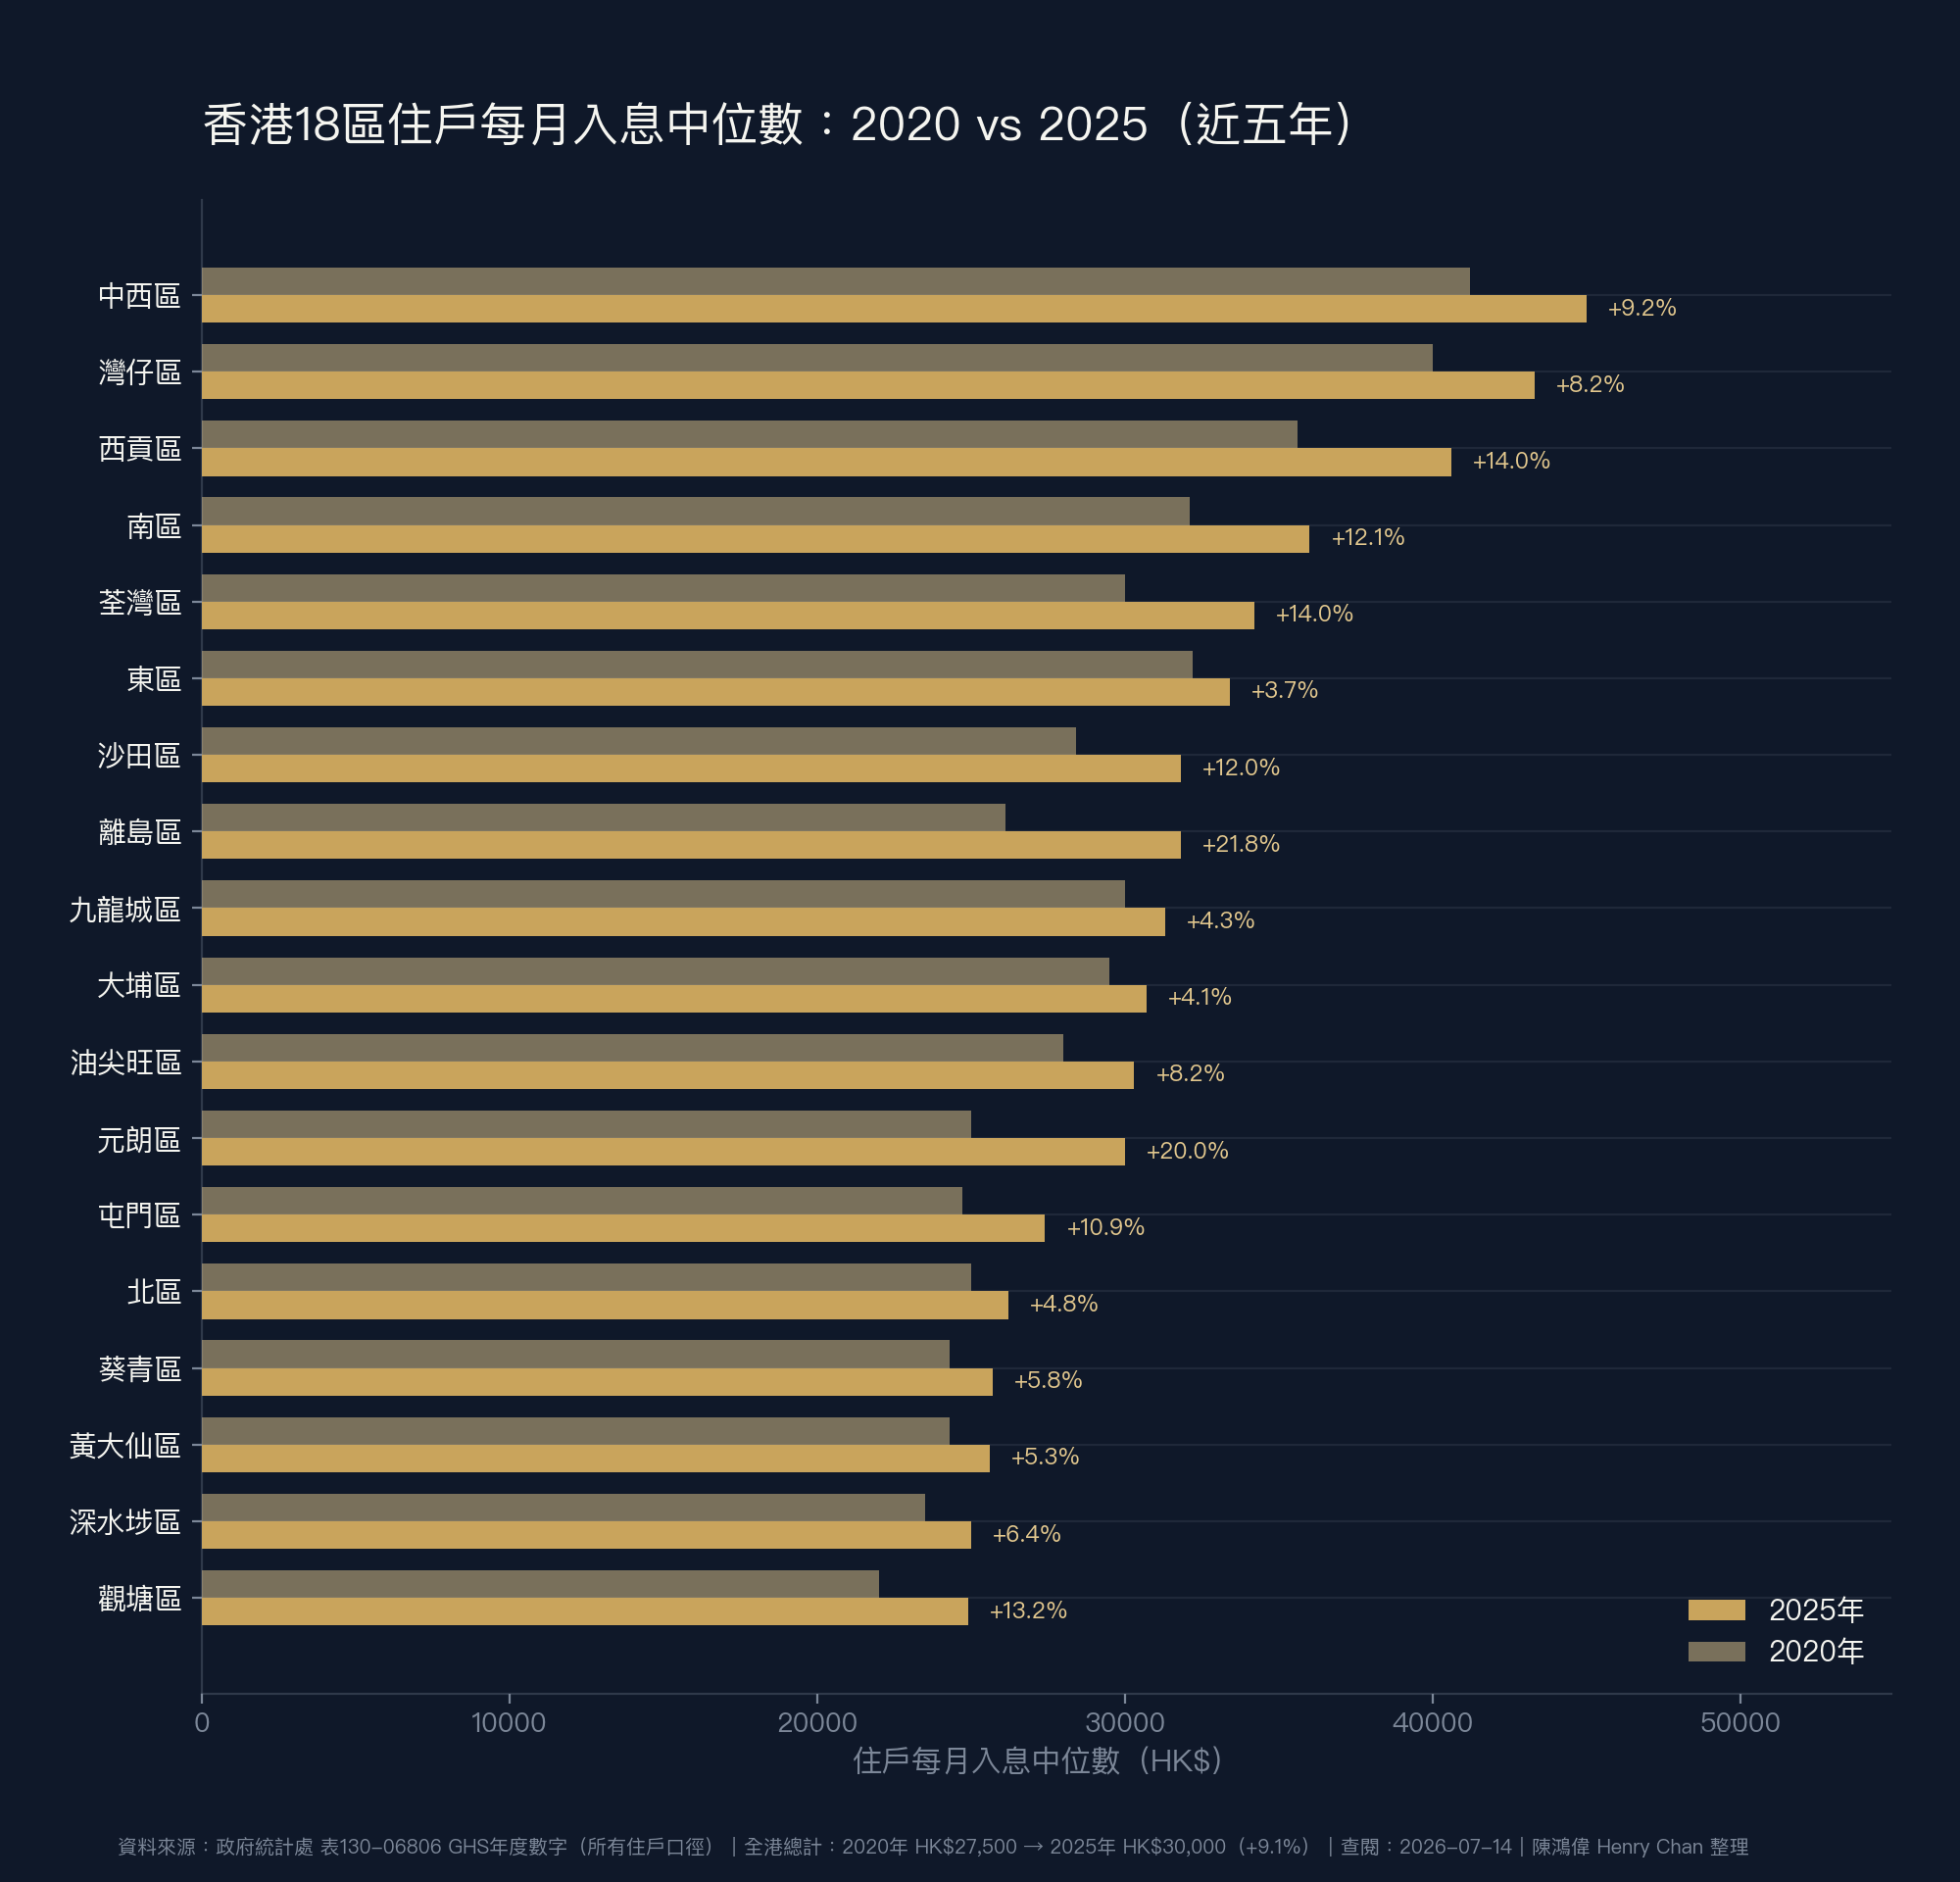
The Census and Statistics Department's "General Household Survey" updates district-level income figures every year (not just in census years); this compares the true most recent five years (2020 → 2025). The territory-wide total rose 9.1% (HK$27,500 → HK$30,000), with big variation across the 18 districts: Islands District (+21.8%) and Yuen Long District (+20.0%) saw the strongest growth, far outpacing the territory-wide average and reflecting the fastest income growth in the New Territories West and Islands over these five years (Sai Kung District and Tsuen Wan District also both grew 14.0%); by contrast, Eastern District (+3.7%), Tai Po District (+4.1%), and Kowloon City District (+4.3%) saw the mildest growth. In terms of income level, Central and Western District (HK$45,000) and Wan Chai District (HK$43,300) remain the top two districts territory-wide, with Kwun Tong District (HK$24,900) now the lowest.
| District | 2020 (HK$) | 2025 (HK$) | 5-Year Change |
|---|---|---|---|
| Central and Western District | 41,200 | 45,000 | +9.2% |
| Wan Chai District | 40,000 | 43,300 | +8.3% |
| Sai Kung District | 35,600 | 40,600 | +14.0% |
| Southern District | 32,100 | 36,000 | +12.1% |
| Tsuen Wan District | 30,000 | 34,200 | +14.0% |
| Eastern District | 32,200 | 33,400 | +3.7% |
| Sha Tin District | 28,400 | 31,800 | +12.0% |
| Islands District | 26,100 | 31,800 | +21.8% |
| Kowloon City District | 30,000 | 31,300 | +4.3% |
| Tai Po District | 29,500 | 30,700 | +4.1% |
| Yau Tsim Mong District | 28,000 | 30,300 | +8.2% |
| Yuen Long District | 25,000 | 30,000 | +20.0% |
| Tuen Mun District | 24,700 | 27,400 | +10.9% |
| North District | 25,000 | 26,200 | +4.8% |
| Kwai Tsing District | 24,300 | 25,700 | +5.8% |
| Wong Tai Sin District | 24,300 | 25,600 | +5.3% |
| Sham Shui Po District | 23,500 | 25,000 | +6.4% |
| Kwun Tong District | 22,000 | 24,900 | +13.2% |
| Territory-wide Total | 27,500 | 30,000 | +9.1% |
Source: Census and Statistics Department, Table 130-06806, "Average household size and median monthly household income of households by District Council district" (General Household Survey, annual figures). Accessed: 2026-07-14. Basis is "all households" (including households with foreign domestic helpers), not "economically active households" (the economically active household median is generally more than 30% higher — for example, Central and Western District's economically active household figure for 2025 is HK$62,200).
The above is territory-wide aggregate data. If you'd like to understand the transaction trends, asking prices, or market timing for a specific estate, feel free to reach out directly — I'll provide practical data tailored to your target.
 Henry Chan 陳鴻偉